Moving behaviour analysis

    Where do the buyers really come from?

    Data-driven insight into regional moving patterns - understand inbound and outbound dynamics down to the neighbourhood level.

    Letzte3 Monate6 Monate12 Monate24 Monate

    270

    Umzüge

    3,1 %

    Entwicklung der Umzüge
    Top-Herkunftsort
    73 % Umzüge aus München
    Mai 25Aug. 25Nov. 25Feb. 26
    Umzüge Umzugstrend
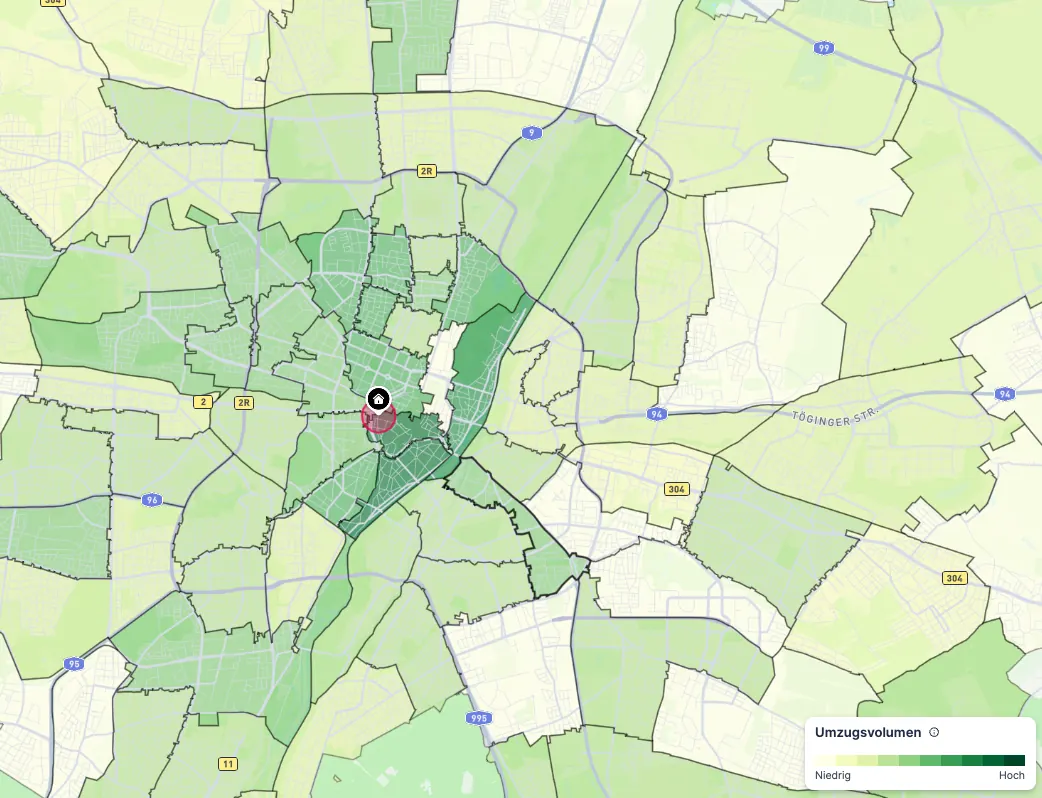
    Umzugsverhalten Heatmap – Umzugsvolumen nach Quartier

    Heatmap

    Inbound regions at a glance.

    See in an interactive heatmap across Germany - on state and postcode level - which regions feed which volume of households into the neighbourhood of your property.

    • Heatmap at state and postcode level
    • Volume per region colour-coded
    • Property location as the anchor
    • Interactive drill-down navigation

    Umzugsverhalten Heatmap – Umzugsvolumen nach Quartier

    Move volume

    Volume across all time frames.

    Keep track of the move volume into the surroundings of the property over 3, 6, 12 and 24 months - including trend development and top origin location.

    • Time frames: 3, 6, 12 and 24 months
    • Total moves and change in %
    • Top origin location at a glance
    • Monthly course with trend line
    Letzte3 Monate6 Monate12 Monate24 Monate

    270

    Umzüge

    3,1 %

    Entwicklung der Umzüge
    Top-Herkunftsort
    73 % Umzüge aus München
    Mai 25Aug. 25Nov. 25Feb. 26
    Umzüge Umzugstrend

    Origin

    Where do the newcomers come from?

    Detailed overview of the origin of all moves - sorted by city, postcode and district, including share and average income.

    • Breakdown by city, postcode and district
    • Absolute move count per region
    • Share of total inbound moves
    • Avg. income of the origin region
    Stadt ▾
    3 Mo6 Mo12 Mo24 Mo
    StadtUmzügeIn %Ø Eink.
    München19873 %4.222 €
    Frankfurt am ...73 %3.658 €
    Bayreuth52 %3.035 €
    Hamburg< 52 %3.281 €
    Augsburg< 51 %3.043 €
    5 / Seite von 20
    ‹1234›

    Income comparison

    Newcomers vs. residents.

    Compare the income distribution of incoming households with the households already living in the neighbourhood - and immediately spot shifts in purchasing power.

    • Distribution across all income brackets
    • Direct comparison inbound vs. existing
    • Recognise purchasing-power trends
    • Basis for target group outreach
    0%20%40%60%0-1k1-1,5k1,5-2k2-2,5k2,5-3k3-4k4-5k5-7k>7k
    Zuziehende Haushalte Haushalte in der Nachbarschaft

    Target group comparison

    Which household types are moving in?

    Compare the target groups of newcomers with the existing households in the neighbourhood - from singles to seniors to families with children.

    • Singles, young singles, seniors, families, couples
    • Direct comparison inbound vs. existing
    • Visible shifts in demographics
    • Direct handover into marketing workflows
    Singles
    Junge Singles
    Alleinst. Senioren
    Familien mit Kind
    Paare
    0 %15 %30 %45 %60 %
    Zuziehende Haushalte Haushalte in der Nachbarschaft

    Marketing that matches reality.

    Instead of guesses about target regions, mobility data delivers factual proof - and makes your campaigns measurably more effective.

    Bugra Yilmazel

    The software helps us present the location of a property in listings and viewings in a modern, digital and vivid way.

    At the same time, data such as moving patterns, income structures and demand potentials help us aim our marketing far more precisely.

    Our owners in particular are regularly impressed by the insights and marketing strategies we can derive in a data-driven way with the help of DeepImmo.

    Bugra Yilmazel

    Real estate agent

    Maklerhaus 1Maklerhaus 2Maklerhaus 3Maklerhaus 4Maklerhaus 5Maklerhaus 6Maklerhaus 7Maklerhaus 8Maklerhaus 9Maklerhaus 10Maklerhaus 11Maklerhaus 12Maklerhaus 13Bartz Immobilien
    Book a demo

    Frequently asked questions

    Relocation dynamics emerge from changes in the labour market, population structure or housing supply. These developments influence both supply and demand in the real estate market. DeepImmo analyses regional movement patterns and makes relevant changes visible.

    Demand for a property depends on location, property type, price level and target group. Decisive is not only the number of potential buyers but also their purchasing power and search behaviour. DeepImmo analyses demand potentials and helps agents better assess a property's market attractiveness.

    Depending on property type, relevant target groups differ significantly. A single-family home often appeals to families, while condominiums can be attractive to investors, singles or seniors. DeepImmo analyses potential buyer groups and shows which target groups demonstrate the highest demand for a property.

    Target-group analyses help show owners who is likely to buy their property and how that target group can be reached. This makes marketing strategies more concrete and easier to follow. DeepImmo supports agents with data-driven target-group analyses and demand models.

    Potential property sellers can often be identified through changes in their life situation as well as market and demand developments. Decisive, however, is not just identification but providing relevant information at the right time. DeepImmo helps agents deliver data-based decision foundations to owners.