Financing calculator

    Who can really afford this property?

    From the list price to the required household income: DeepImmo breaks every financing down into clear building blocks - transparent, interactive and ready for owner conversations.

    1

    Kaufpreisübersicht

    ···
    Vermarktungspreis900.000 €
    Transaktionskosten
    9,1 %+81.630 €
    Grunderwerbsteuer
    3,5 %+31.500 €
    Notar- und Grundbuchgebühren
    2 %+18.000 €
    Maklergebühren
    3,57 %+32.130 €
    Eigenkapital
    20 %−180.000 €
    Zu finanzierender Kaufbetrag 801.630 €

    Nettoeinkommens-Heatmap München

    Purchase price overview

    From list price to actual financing needs.

    DeepImmo transparently breaks the purchase price into all its components: transaction costs, real estate transfer tax, notary and agent fees as well as equity - down to the amount that actually needs financing.

    • Complete breakdown of all closing costs
    • Regional transfer tax automatically applied
    • Equity flexibly adjustable
    • Amount to be financed in real time
    1

    Kaufpreisübersicht

    ···
    Vermarktungspreis900.000 €
    Transaktionskosten
    9,1 %+81.630 €
    Grunderwerbsteuer
    3,5 %+31.500 €
    Notar- und Grundbuchgebühren
    2 %+18.000 €
    Maklergebühren
    3,57 %+32.130 €
    Eigenkapital
    20 %−180.000 €
    Zu finanzierender Kaufbetrag 801.630 €

    Monthly payment

    Financing payment with interest and principal at a glance.

    The monthly payment is calculated to the cent - including the split between interest and principal, term and initial repayment rate.

    • Exact monthly payment based on current interest rates
    • Visual split between interest and principal
    • Variable terms and repayment rates
    • Immediately understandable for owners
    2

    Monatliche Finanzierungsrate

    ···

    3.820 € pro Monat

    bei einer Laufzeit von 30 Jahren bzw. einer initialen Tilgung von 1,73 %

    ZinsenTilgung
    2.661 € (70 %)1.158 € (30 %)

    Required income

    What household income is needed to finance this?

    The waterfall view shows which income bracket can actually carry the financing - including a marker for the matching target group.

    • Required net income per month
    • Affordable purchase price per income bracket
    • Direct link to target groups
    • Argumentation base for the pricing conversation
    3

    Notwendiges Netto-Haushaltseinkommen

    ···

    10.914 € pro Monat

    Zur Finanzierung erforderliches Netto-Haushaltseinkommen

    801.630 €600 €450 €300 €150 €0 €2.000-2.500 €2.500-3.000 €3.000-4.000 €4.000-5.000 €5.000-7.000 €> 7.000 €

    Monatliches Netto-Haushaltseinkommen

    Finanzierbarer Kaufpreis
    Passende Einkommensklasse
    Zu finanzierender Kaufbetrag

    Local buyer potential

    How many households in the region can really afford this?

    The income distribution is compared on three levels - 5-minute radius, postcode and city - and immediately shows where the matching income bracket is concentrated.

    • Comparison across three geo levels
    • Matching income bracket highlighted in colour
    • Buyer potential in the immediate surroundings
    • Data foundation for targeted marketing

    Netto-Haushaltseinkommens­verteilung in den Zuzugsregionen der Immobilie

    ···

    Vergleich mit

    5 Min
    Postleitzahl
    Stadt
    0 %20 %40 %60 %80 %2.000-2.500€2.500-3.000€3.000-4.000€4.000-5.000€5.000-7.000€mehr als7.000 €

    Anteil der Haushalte

    Zuzugsregionen
    Passende Einkommen in den Zuzugsregionen
    5 Min

    Household calculation

    What share of income goes into the financing?

    The curve shows, for every income bracket, what percentage of household income would have to go into the monthly payment - including a 35% monthly budget marker.

    • Income share per bracket from €1,000 to €7,000
    • Comparison against the 35% monthly budget
    • Clear identification of realistic buyers
    • Clear reasoning for the pricing strategy
    4

    Haushaltsrechnung

    ···

    Diese Darstellung zeigt, wie viel Haushalte mit unterschiedlichen Einkommensniveaus für die Finanzierung der Immobilie aufwenden müssen.

    100 %200 %300 %400 %Monatsbudget: 35 %1.000 €2.000 €3.000 €4.000 €5.000 €6.000 €7.000 €Einkommensanteil

    Monatliches Netto-Haushaltseinkommen

    Income contextualisation

    Required income vs. average in the inbound regions.

    A colour scale places the required household income next to the average net income of the inbound regions - including the difference down to the euro.

    • Visual comparison of avg. income vs. required income
    • Traffic-light scale from realistic to critical
    • Clear income gap
    • Tied to real inbound regions instead of postcodes

    Einschätzung des Nettoeinkommens

    ···

    Hier wird das erforderliche Netto-Haushaltseinkommen im Kontext des durchschnittlichen Einkommens in den Zuzugsregionen der Immobilie eingeordnet.

    5.855 €

    Ø Nettoeinkommen

    10.914 €

    Erf. Einkommen

    0 €4.584 €9.167 €
    + 5.058 €

    Equity check

    How long would buyers have to save for the equity?

    DeepImmo relates the required equity to the region's average annual net income and shows how many years would realistically be needed to save it up.

    • Income multiplier as a reality check
    • Average saving period in years
    • Instant assessment of attainability
    • Clear argument when the equity share is too high

    Einschätzung des notwendigen Eigenkapitals

    ···

    Diese Berechnung zeigt das Verhältnis von Eigenkapital zum Ø jährlichen Nettoeinkommen und ermittelt, wie viele Jahre in den Zuzugsregionen für die Ansparung benötigt würden.

    180.000 € Eigenkapital

    2,6x Ø Nettoeinkommen p.a.

    Einkommens Multiplikator

    24,6 Jahre im Durchschnitt

    Eigenkapital Ansparzeitraum

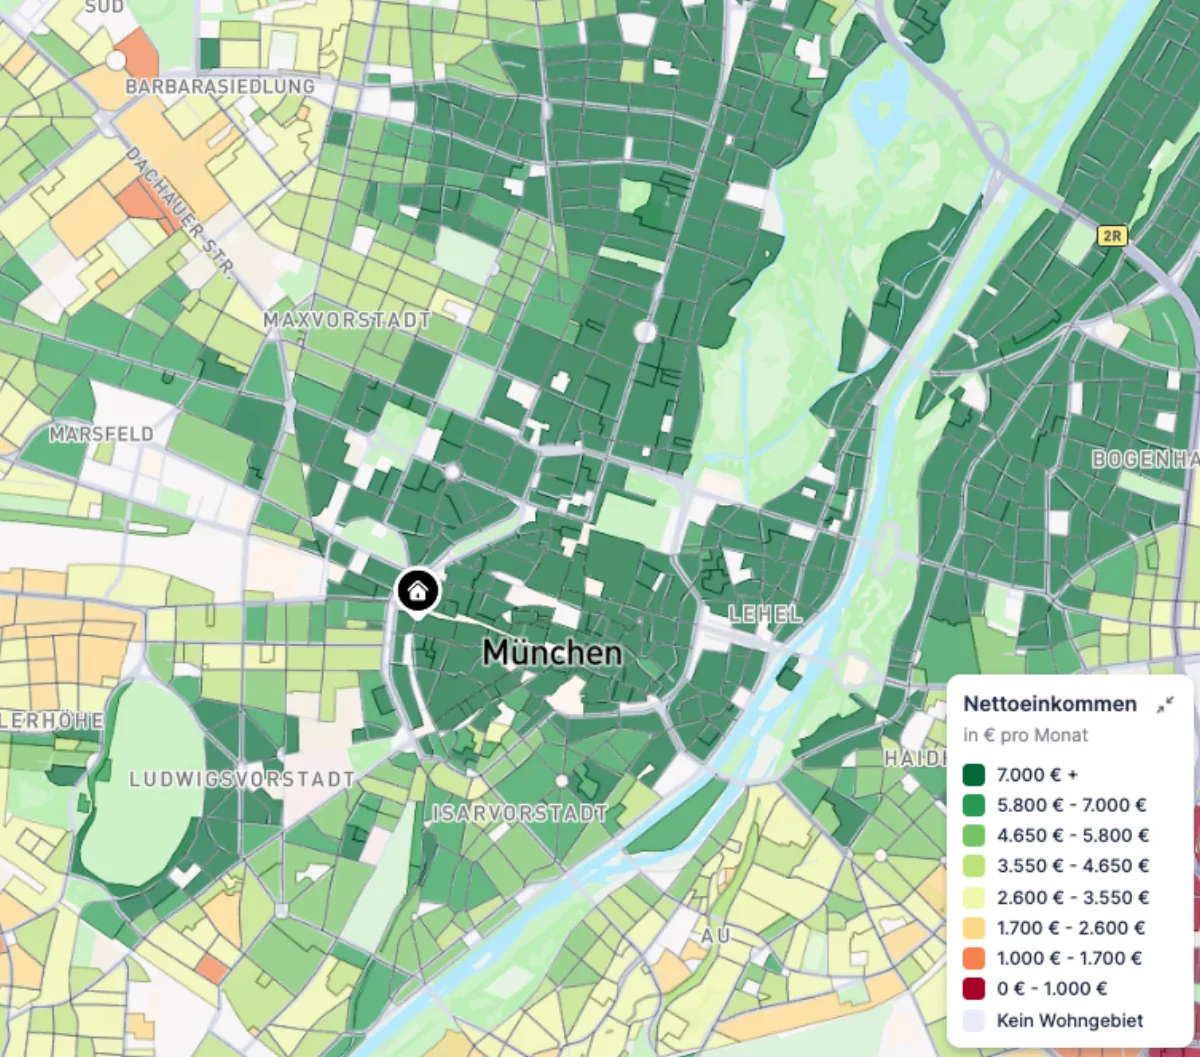
    Income heatmap

    Where do the households that can afford your property actually live?

    The geographic heatmap displays net household income at neighbourhood level - so you instantly see in which locations around your property the matching buyer potential is concentrated.

    • Income distribution at neighbourhood level
    • Eight income brackets from €0 to €7,000+
    • Direct reference to your property's location
    • Foundation for targeted buyer outreach
    Nettoeinkommens-Heatmap München

    Financing clarity at the click of a button.

    The financing calculator builds trust - with owners, buyers and in every advisory conversation.

    Sebastian Frank

    For me, DeepImmo is a real game-changer in our daily client advisory work.

    The acquisition calculator and the radar in particular provide a unique window into the market and into highly professional market assessment.

    For me it is and remains a core building block of professional marketing.

    Sebastian Frank

    Real estate agent

    Maklerhaus 1Maklerhaus 2Maklerhaus 3Maklerhaus 4Maklerhaus 5Maklerhaus 6Maklerhaus 7Maklerhaus 8Maklerhaus 9Maklerhaus 10Maklerhaus 11Maklerhaus 12Maklerhaus 13Bartz Immobilien
    Book a demo

    Frequently asked questions

    Demand for a property depends on location, property type, price level and target group. Decisive is not only the number of potential buyers but also their purchasing power and search behaviour. DeepImmo analyses demand potentials and helps agents better assess a property's market attractiveness.

    Depending on property type, relevant target groups differ significantly. A single-family home often appeals to families, while condominiums can be attractive to investors, singles or seniors. DeepImmo analyses potential buyer groups and shows which target groups demonstrate the highest demand for a property.

    Owners are primarily interested in information relevant to their personal situation. This includes current market prices, price trends, comparable properties, competing offers, demand potentials, financing conditions, buyer groups and marketing duration. The more specific and local the information, the higher its relevance. DeepImmo bundles this data in one platform and enables agents to provide owners with a well-founded decision basis.

    Owners want to understand: What is my property worth? How is the market developing? How strong is demand? How long does a sale take? Which buyers are relevant? The better these questions are answered, the more likely owners are to build trust in the agent. DeepImmo provides exactly this information on a data-driven basis.

    The current market situation should be explained with transparent data. This includes price trends, supply and demand, financing conditions, competing properties and regional specifics. Instead of general statements, agents should present concrete figures and local developments. DeepImmo supports this with up-to-date market analyses and regional data models.